How Do I Change the Day on Which Relative Values are Compared? (V4)
In Studylog’s Graphs and Reports, you can not only see collected data, but also see percent difference/change calculations relative to that data. However, you must first set a date on which relative values are to be compared. Here’s how to do that:
1. Open a study with either [New] or [Edit]:
[New]:
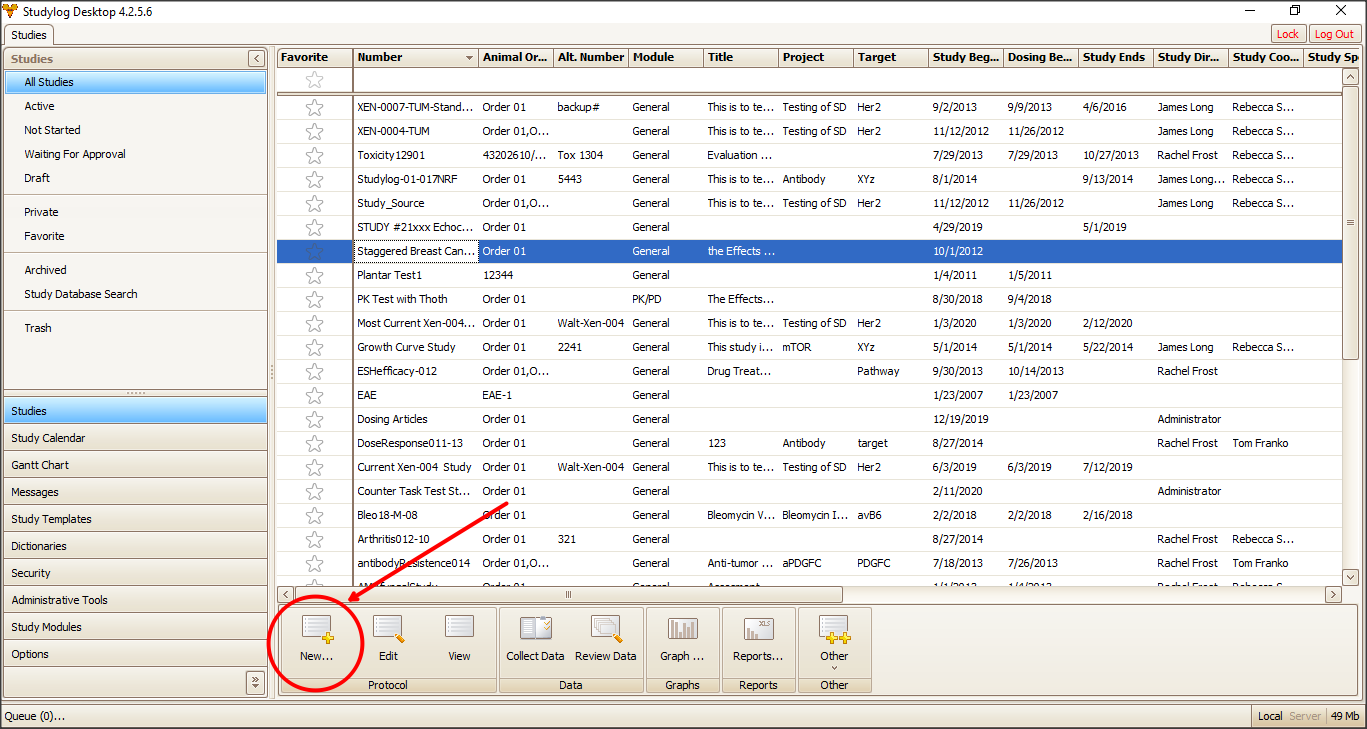
1. Open a study with either [New] or [Edit]:
[New]:
[Edit]:
2. Go to the Tasks tab. In the Initial Measurement for Relatives drop-down menu, you can choose the date from which the initial measurements will be used. There are several options and you can even choose a custom date.
Once you have chosen a date, graphs and reports generated for that study will calculate difference/change relative to the initial value you chose.